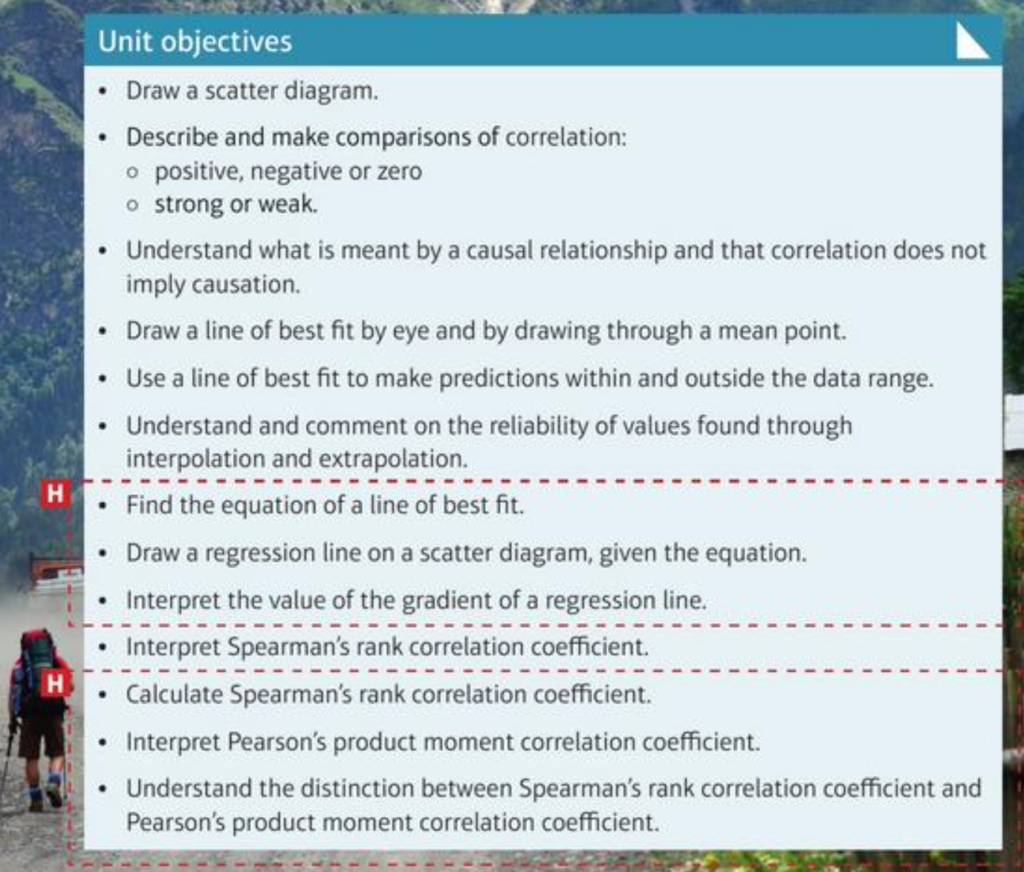
4 Scatter diagrams and correlation
4.1 Scatter diagrams Link
Draw a scatter diagram.
Recognise whether or not two variables are associated.
Know the difference between an explanatory (independent) and a response (dependent) variable.
4.2 Correlation Link
Recognise where there is a positive correlation, negative correlation or no correlation.
Describe and make comparisons of strong and weak correlation.
4.3 Causal relationships Link
Understand what is meant by a causal relationship.
Know that correlation does not imply causation.
Additional videos: Link
4.4 Line of best fit Link
Draw a line of best fit:
by eye
by drawing through a mean point.
Scatter graph pack – Corbett Maths Link contains questions and answers
4.5 Interpolation and extrapolation Link
Use interpolation to estimate values from a line of best fit.
Use extrapolation to estimate values from a line of best fit.
Understand that values estimated by interpolation and extrapolation may not be reliable.
Additional video Link
4.6 The equation of a line of best fit Link
Interpret the value of the gradient and y-intercept.
4.7 Spearman’s rank correlation coefficient Link
Interpret Spearman’s rank correlation coefficient ni the context of the problem.
Additional resource video: Link
Edexcel statistics Unit 4 spearmans foundaton and Statistics Unit 4 Spearmans foundation answers
Video: Link this is the additional example included in the class video for proving that -1 x -1 is not 0
Additional resources: Link
Link
Quizlet Link
General questions Statistics Unit 4 scatter graph questons foundation
Answers Statistics Unit 4 scatter graph questons foundation answers
4 Check up
4 Strengthen
4 Extend
4 Summary
Scatter diagrams and correlation
• W h e n you draw a scatter diagram, plot the explanatory (independent) variable on the horizontal axis and the response (dependent) variable on the vertical axis.
• Two variables are correlated fi they show an increasing or decreasing trend: as one variable increases, the other variable increases or decreases.
• When a change in one variable directly causes a change ni another variable, there is a causal relationship between them.
Correlation does not imply acausal relationship.
Lines of best fit and the equation ofa straight line
• A line ofbest fit is a straight line drawn so that the plotted points on a scatter
diagram are evenly scattered on either side of the line. To get a good fit, draw your line through the mean point (x, y).
• Using a line of best fit to estimate data values within the range of the data is interpolation. Values estimated by interpolation are usually reliable.
• Using a line of best fit to estimate data values outside the range of the data is extrapolation. Values estimated by extrapolation are less reliable the further they are from the known data.
•The equation of the line y = ax + b has gradient a and its intercept on they-axis is (0, b).
Correlation coefficients
•Spearman’s rank correlation coefficient r; measures the strength of the correlation between two sets of data.
• If r, is close to 1 there is a strong positive correlation.
•If r is 0 there is no correlation.
•If r, is close to -1 there is strong negative correlation.
4 Test


