
5.1 Line graphs and time series Link
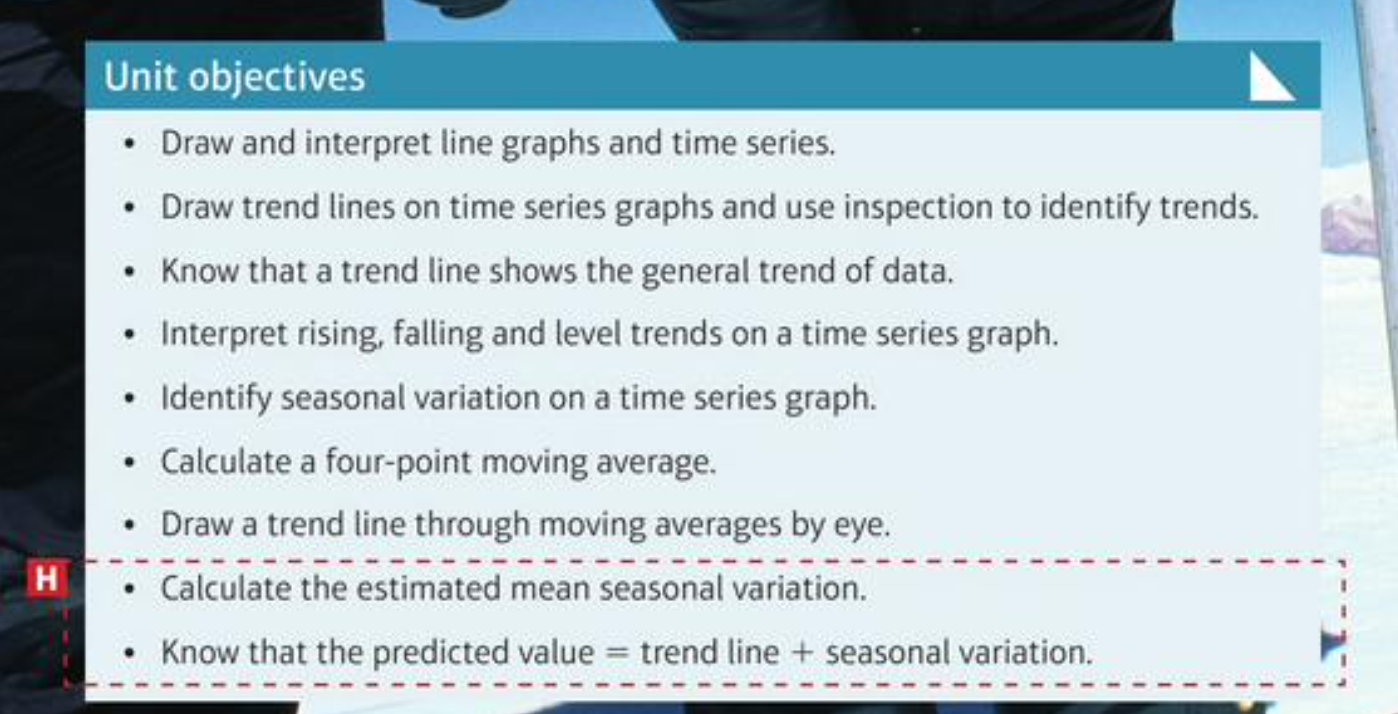
Draw and interpret line graphs and time series.
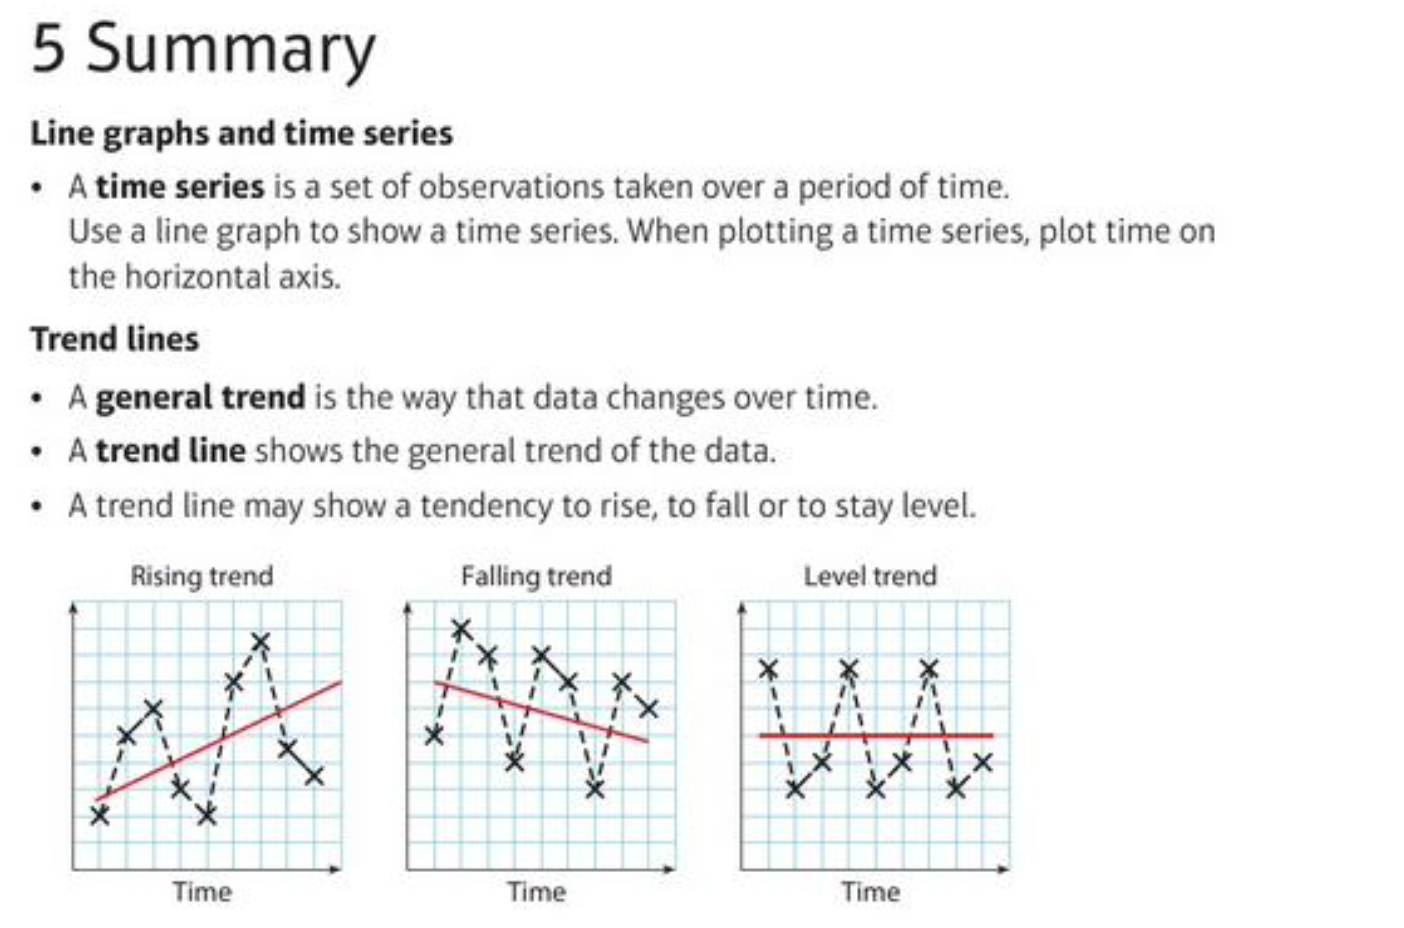
5.2 Trend lines Link
D r a w trend lines on time series graphs and use inspection to identify trends.
Know that a trend line shows the general trend of data and interpret a rising trend, a falling trend or a level trend on a time series graph.
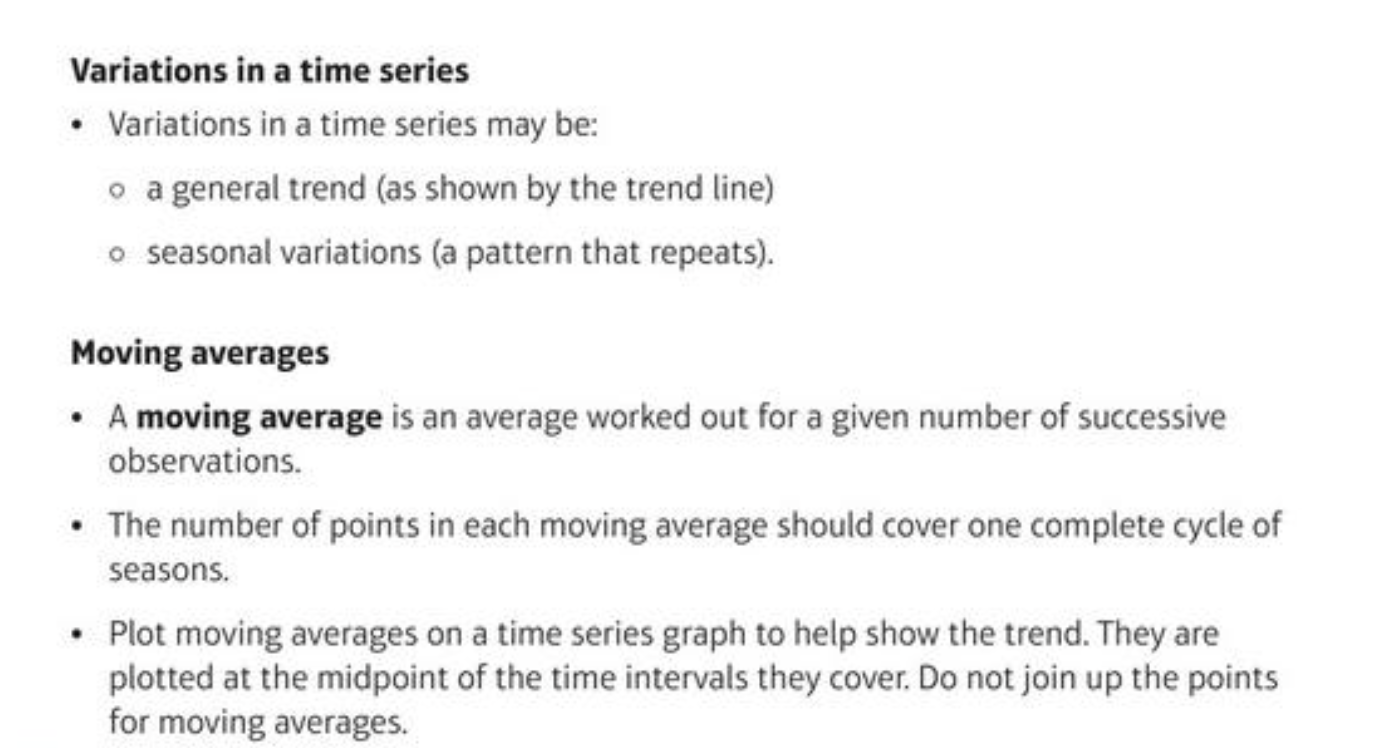
5.3 Variations in a time series Link
Identify seasonal variation on a time series graph.
5.4 Moving averages Link
Calculate a four-point moving average.
Draw a trend line through moving averages by eye.
5 Check up Link for all of the following
5 Strengthen
5 Extend
5 Test
Course: GCSE Statistics