
Summarising Data

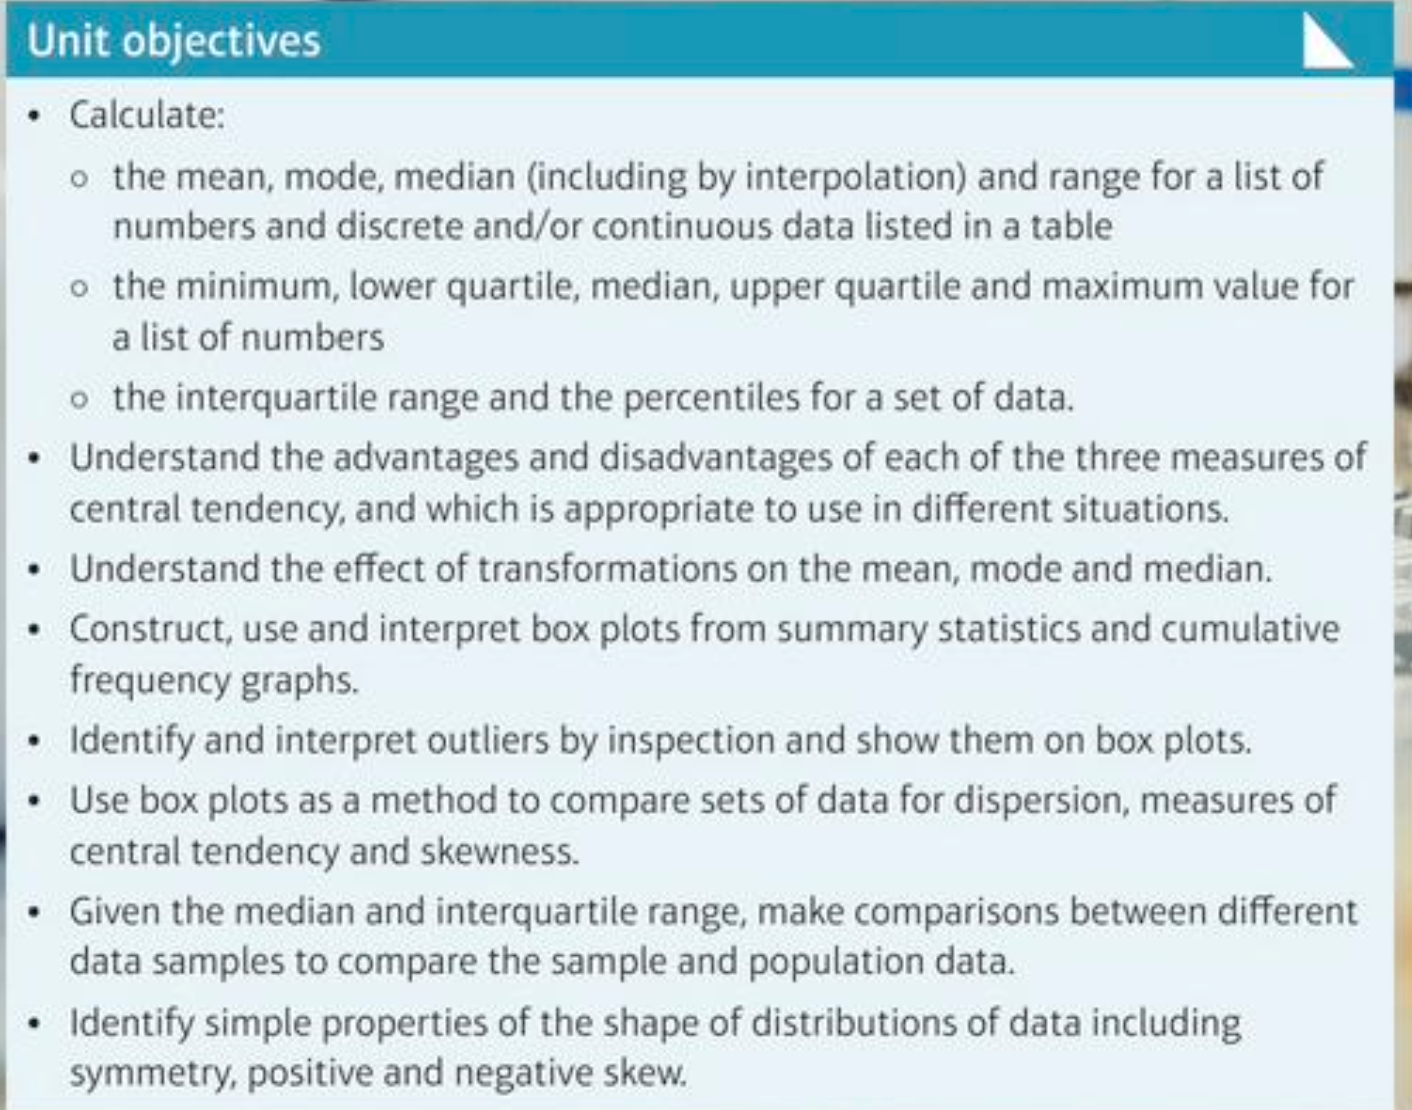
3.1 Averages Link
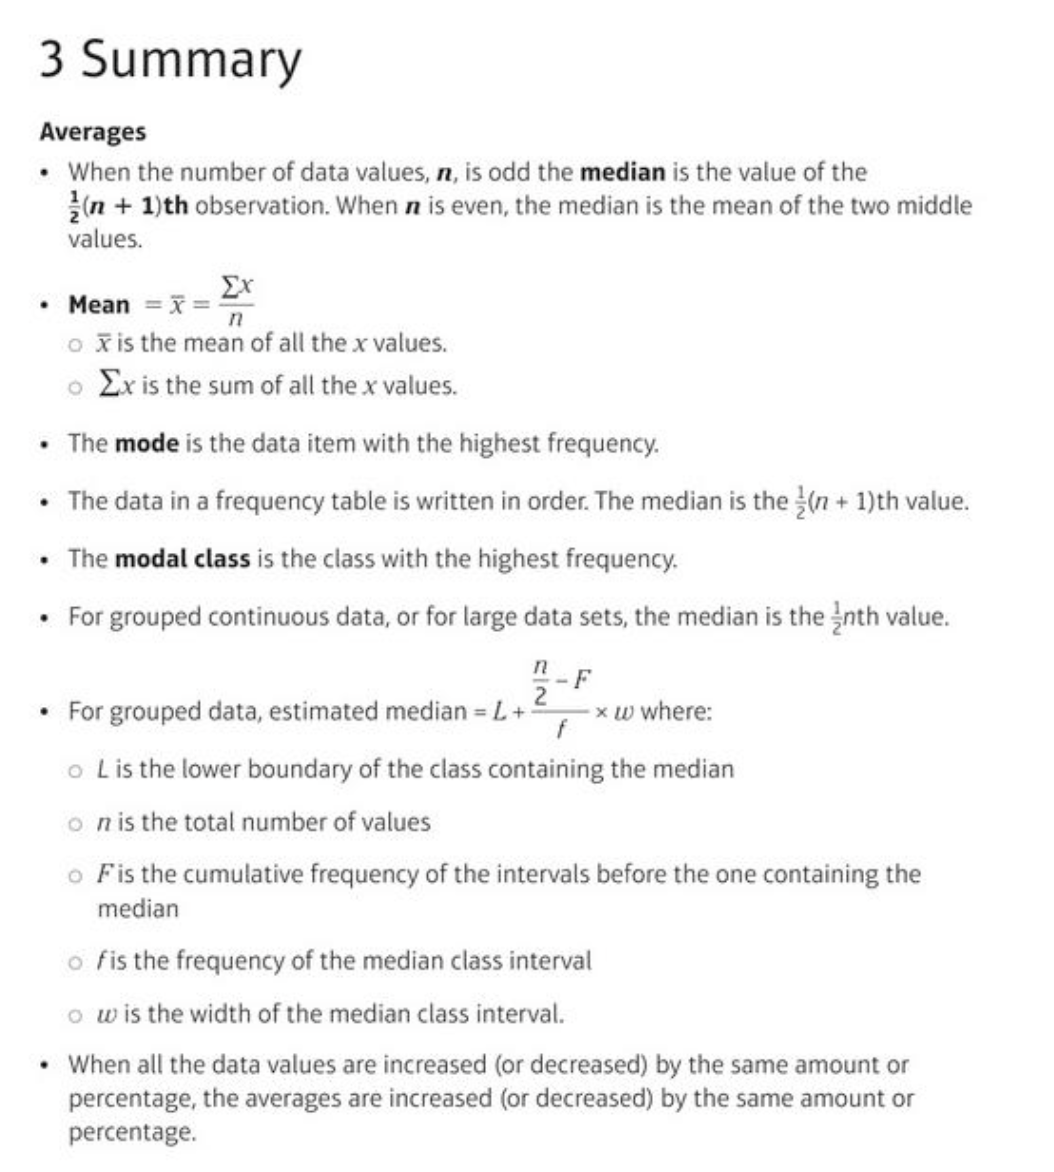
Calculate mode, median and mean for a set of data.
Find averages from charts and graphs.
3.2 Averages from frequency tables Link
F i n d the mode and median from a frequency table. •
Calculate the mean from a frequency table.
3.3 Averages from grouped data Link. pre-recorded class not face to face
F i n d the modal class and the class containing the median from grouped data.
Calculate estimates of the mean and median from grouped data.
Useful video Link
3.4 Transforming data Link
Understand the effect of transformations of data on the mean, mode and median.
Transform data to simplify calculations for the mean.
3.6 Measures of dispersion for discrete data Link
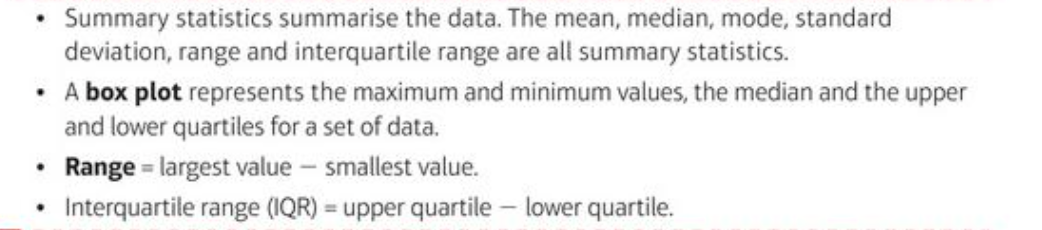
Calculate the range, quartiles and interquartile range of discrete data
3.7 Measures of dispersion for grouped data Link
Calculate the range, quartiles and interquartile range of grouped data.
Calculate percentiles.
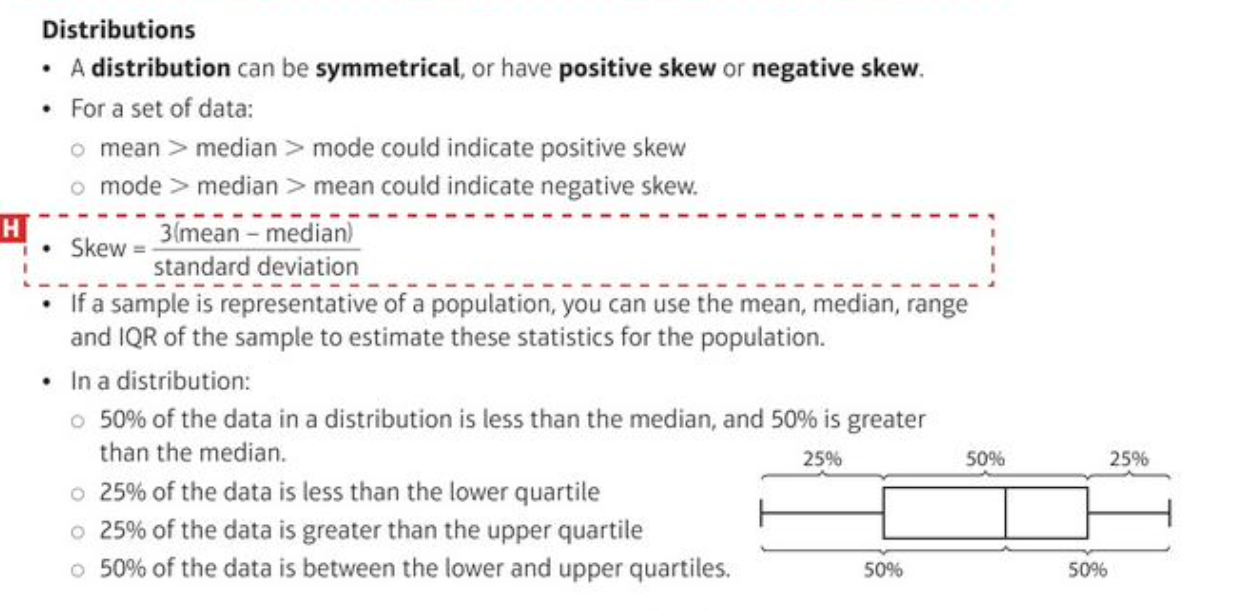
3.9 Box plots and outliers Link
Draw and interpret box plots.
Identify outliers by inspection
3.10 Skewness Link
Determine skewness from data by inspection.
3.11 Deciding which average to use Link
Decide which average is best to use ni different contexts.
Justify the choice of average.
3.12 Comparing data sets Link
Compare data sets using averages and measures of spread.
Compare data sets from diagrams.
3.13 Making estimates Link
Use summary statistics for samples to predict population characteristics.
3 Check up Link
3 Strengthen in link above
3 Extend in link above
Test in link above
Summary
Test: